Next: Polymer and Nanocrystal Organizations Up: Multiscale Molecular Simulation of Previous: Multiscale Molecular Simulation of Contents
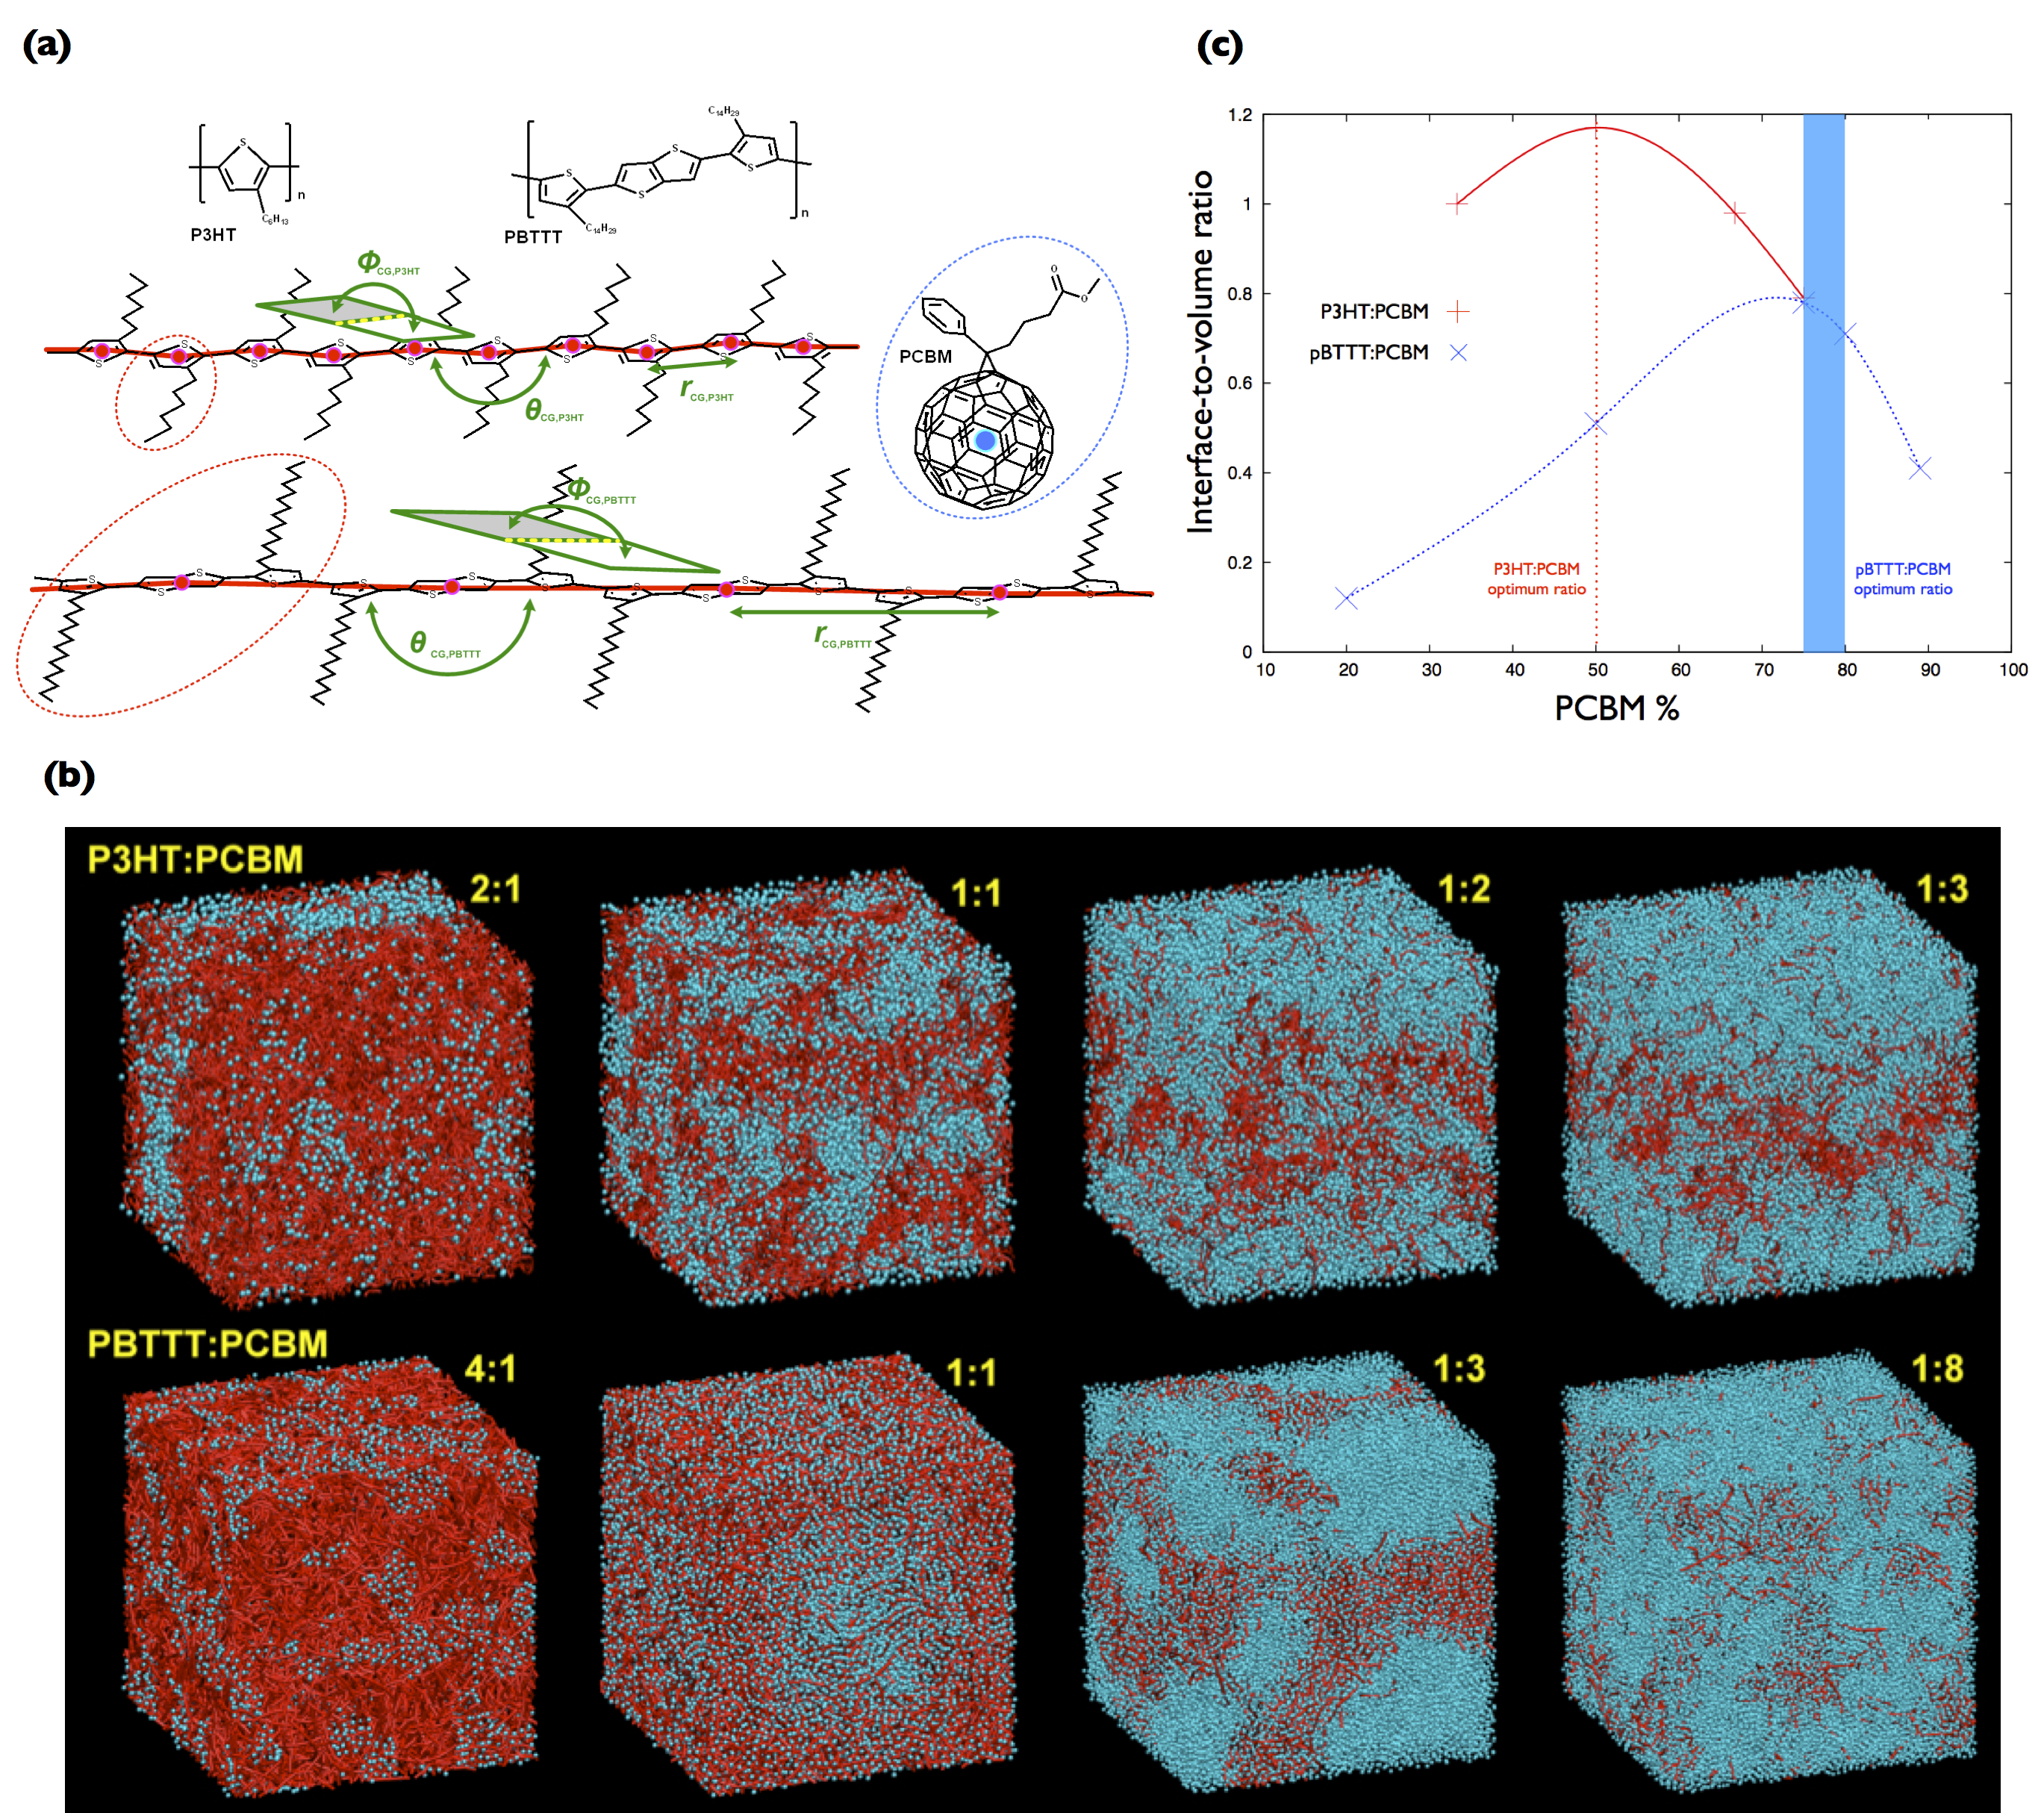
![[*]](crossref.png) a. We employed a structural-based scheme to fit the CG force fields between all CG degrees of freedom (e.g. CG bond length, angles, and dihedrals, see Fig. a). In this scheme, the CG force fields were fitted such that the distribution functions of CG degrees of freedom from all-atom molecular dynamics simulations can be reproduced by our CG model. The distribution functions of CG bond length, angles, dihedrals, and radial distribution functions between CG atomic pairs from the CG forcefield we fitted can successfully reproduce those from all-atom MD simulations, validating our CG models for P3HT:PCBM and PBTTT:PCBM blends. Then, we carried out a series of large-scale CGMD simulations of thermal annealing processes of P3HT:PCBM and PBTTT:PCBM blends with various donor/acceptor blending ratios, see Fig. b. Note that the system sizes of our CGMD simulations were about
[IMAGE png] and
[IMAGE png] [IMAGE png] for P3HT:PCBM and PBTTT:PCBM blends, respectively, which are compatible with those in experiments. The BHJ morphology of the 1:1 P3HT:PCBM blend is in excellent agreements with agreements with available experimental data; furthermore, our CGMD simulations can provide insights into the nanomorphologies of other donor/acceptor blending ratios that are still elusive from experimental perspectives. In order to evaluate BHJ morphological properties quantitatively, we developed a spatial-discretization scheme. Figure c displays the specific interfacial area (interface-to-volume ratio) - a morphological quantity that is directly correlated with exciton dissociation rates - as the function of donor/acceptor blending ratios. Our morphological property analysis indicated that the blends with the optimal donor/acceptor blending ratios from experiments must have the highest specific interfacial area for both P3HT:PCBM and PBTTT:PCBM blends to maximize exciton dissociation rates. Furthermore, our CGMD simulations indicated that the solubility of PCBM in donor polymers is another critical factor determining the optimal blending ratio. From Fig. b it is evident that pure PCBM domains did not precipitate until PBTTT:PCBM blending ratio reaching beyond 1:1, which can be attributed to the finite solubility of PCBM in PBTTT matrix; hence, in PBTTT:PCBM blends, the optimal donor/acceptor blending ratio is around 1:3 because more PCBM molecules must be added to form pure PCBM domains. In summary, we successfully constructed a multiscale, coarse-grained molecular simulation platform that can simulate the nanomorphology evolution of polymer/fullerene blends during annealing processes, with system sizes compatible with those in experiments; furthermore, our CGMD simulations can reveal morphological details that are yet difficult to be evaluated from experiments. This project was in collaboration with Dr. Chih-Wei Chu at RCAS, and the results of this study have been published in the Energy [IMAGE png] Environmental Science (DOI:10.1039/C1EE01508G) and the Journal of Physical Chemistry C (DOI:10.1021/jp3028947).
a. We employed a structural-based scheme to fit the CG force fields between all CG degrees of freedom (e.g. CG bond length, angles, and dihedrals, see Fig. a). In this scheme, the CG force fields were fitted such that the distribution functions of CG degrees of freedom from all-atom molecular dynamics simulations can be reproduced by our CG model. The distribution functions of CG bond length, angles, dihedrals, and radial distribution functions between CG atomic pairs from the CG forcefield we fitted can successfully reproduce those from all-atom MD simulations, validating our CG models for P3HT:PCBM and PBTTT:PCBM blends. Then, we carried out a series of large-scale CGMD simulations of thermal annealing processes of P3HT:PCBM and PBTTT:PCBM blends with various donor/acceptor blending ratios, see Fig. b. Note that the system sizes of our CGMD simulations were about
[IMAGE png] and
[IMAGE png] [IMAGE png] for P3HT:PCBM and PBTTT:PCBM blends, respectively, which are compatible with those in experiments. The BHJ morphology of the 1:1 P3HT:PCBM blend is in excellent agreements with agreements with available experimental data; furthermore, our CGMD simulations can provide insights into the nanomorphologies of other donor/acceptor blending ratios that are still elusive from experimental perspectives. In order to evaluate BHJ morphological properties quantitatively, we developed a spatial-discretization scheme. Figure c displays the specific interfacial area (interface-to-volume ratio) - a morphological quantity that is directly correlated with exciton dissociation rates - as the function of donor/acceptor blending ratios. Our morphological property analysis indicated that the blends with the optimal donor/acceptor blending ratios from experiments must have the highest specific interfacial area for both P3HT:PCBM and PBTTT:PCBM blends to maximize exciton dissociation rates. Furthermore, our CGMD simulations indicated that the solubility of PCBM in donor polymers is another critical factor determining the optimal blending ratio. From Fig. b it is evident that pure PCBM domains did not precipitate until PBTTT:PCBM blending ratio reaching beyond 1:1, which can be attributed to the finite solubility of PCBM in PBTTT matrix; hence, in PBTTT:PCBM blends, the optimal donor/acceptor blending ratio is around 1:3 because more PCBM molecules must be added to form pure PCBM domains. In summary, we successfully constructed a multiscale, coarse-grained molecular simulation platform that can simulate the nanomorphology evolution of polymer/fullerene blends during annealing processes, with system sizes compatible with those in experiments; furthermore, our CGMD simulations can reveal morphological details that are yet difficult to be evaluated from experiments. This project was in collaboration with Dr. Chih-Wei Chu at RCAS, and the results of this study have been published in the Energy [IMAGE png] Environmental Science (DOI:10.1039/C1EE01508G) and the Journal of Physical Chemistry C (DOI:10.1021/jp3028947).
 |
barbarossapao 2015-09-16