Next: Thermal Transport Properties in Up: Multiscale Simulations of Graphene Previous: Structural and Dynamic Properties Contents
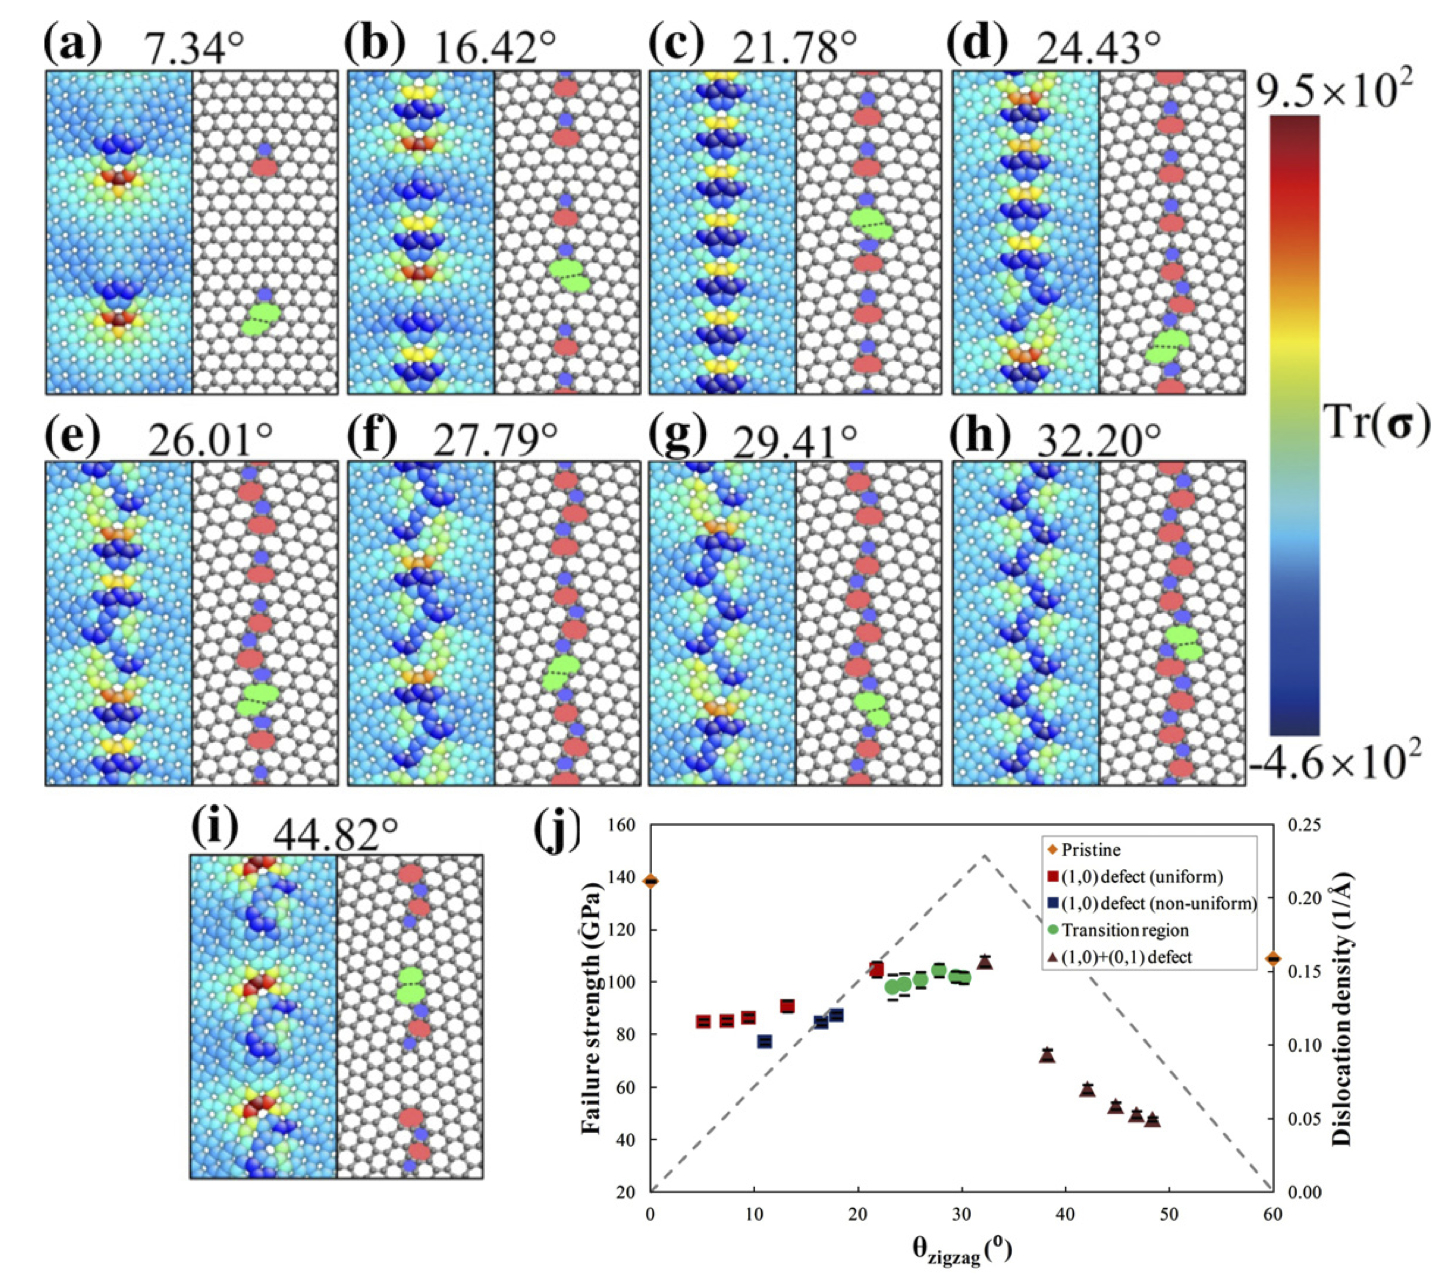
![[*]](crossref.png) j. Our simulations revealed that, for GBs with uniformly distributed GB dislocations (red squares and purple triangles in Fig. j), a higher dislocation density yields a counterintuitive higher GB failure strength; this trend is disrupted, however, by GBs having a non-uniform dislocation distribution (blue squares and green circles in Fig. j). Hence, our study indicates that, in addition to the dislocation density, the distribution of GB dislocations also plays an important role in determining the GB failure strength. Figures a-i display the correlation between the level of the initial atomistic stress distribution and onset of bond rupture. From Figs. a,c,h,i, we found that for GBs featuring a uniform dislocation distribution, a higher misorientation angle will yield a higher failure strength as a result of overlapping and mutual cancelation of the strain fields of neighboring dislocations. For GBs with a non-uniform dislocation distribution (Figs. b,d-g), however, local structural inhomogeneity introduces large local tensile stresses and the failure strength decreases significantly. Therefore, a complicated interplay exists between the dislocation density and distribution, and the failure strength of graphene grain boundaries. This work has been published in the journal CARBON (DOI:10.1016/j.carbon.2012.03.012).
j. Our simulations revealed that, for GBs with uniformly distributed GB dislocations (red squares and purple triangles in Fig. j), a higher dislocation density yields a counterintuitive higher GB failure strength; this trend is disrupted, however, by GBs having a non-uniform dislocation distribution (blue squares and green circles in Fig. j). Hence, our study indicates that, in addition to the dislocation density, the distribution of GB dislocations also plays an important role in determining the GB failure strength. Figures a-i display the correlation between the level of the initial atomistic stress distribution and onset of bond rupture. From Figs. a,c,h,i, we found that for GBs featuring a uniform dislocation distribution, a higher misorientation angle will yield a higher failure strength as a result of overlapping and mutual cancelation of the strain fields of neighboring dislocations. For GBs with a non-uniform dislocation distribution (Figs. b,d-g), however, local structural inhomogeneity introduces large local tensile stresses and the failure strength decreases significantly. Therefore, a complicated interplay exists between the dislocation density and distribution, and the failure strength of graphene grain boundaries. This work has been published in the journal CARBON (DOI:10.1016/j.carbon.2012.03.012).
 |
barbarossapao 2015-09-16
![[IMAGE png]](img21.png)