Research:
Cellular Membrane Dynamics
We measured the membrane topography and dynamics on a living fibroblast by using the non-interferometric widefield optical profilometry (NIWOP) technique. With a water-immersion objective of a 0.75 numerical aperture, our NIWOP system provides depth resolution about 20 nm. The imaging speed could be as high as 5 frames/min. We directly observed and profiled the inward propagation of membrane ripples near the cell edge. To verify if the membrane activity was driven by the underlying cytoskeleton, we changed the structure of the cell cortex while observing the membrane topography. After dissolving the actin cortex by cytochalasin D, we found that the propagation of the membrane ripples disappeared and the edge of the cell shank. The non-contact NIWOP technique does not affect the motility and viability of cells and therefore is suitable for the studies on cell physiology related to membrane motions.

Propagation of the membrane ripples on a fibroblast. (a) to (e) are the zoom-in images of the region enclosed by the dashed rectangle in the whole-view image. An arrow indicates one of the ripples for a better visualization of the propagation. From (a) to (e) we see the ripples are moving away from the cell edge with an average speed about 1.3 μm/hour. The right panel shows the movie of the membrane propagation. We treated the cell with cytochalasin D at 3:00:00. The membrane ripples disappeared 20 minutes later.
Membrane dynamics and cytoskeletons
Combining the NIWOP technique with fluorescence microscopy, we observe the membrane activities of a living cell as well as the structures of its cytoskeletons. The membrane ripples of a lamellipodium are related to similar structures of the underlying actin filaments.
Time-lapse images of the membrane motion and the cortex actin of a lamellipodium. In each panel the upper is the membrane topography obtained by NIWOP and the lower is the actin distribution. The concentric membrane ripples appear in panel (a) and then propagate from the left to the right. However, concentric structures of the actin filaments do not appear until 30 minutes [panel (b)]. After 210 minutes the membrane ripples spread on this lamellipodium [panel (d)]. The movie to the right shows continuous variation of the membrane and the actin filaments. We also treat the cell with cytochalasin D at 4:10:00. We find that the membrane ripples disappeared later than the dissolution of actin filaments. This is consistent with the elastic Brownian ratchet model of cell motility.
Propagation characteristics of active membrane waves
We characterize active membrane waves in details on HS68 fibroblasts. The amplitudes of these waves are smaller than 300 nm, the wave speeds increase from 10 nm/s at the edges to 25 nm/s after ~20 µm of centripetal propagation. The wavelengths approach a steady-state value, but the amplitudes decrease gradually. The dispersion relation and amplitude frequency response of these waves are consistent to a simple mathematical model proposed by Prof. Nir S. Gov at Weizmann Institute of Science, Israel. We also verify that these active membrane waves are driven by the interactions between myosin II and actin polymerization in the cytoplasm.
(a) Dispersion relation of membrane waves. In this figure, q is the wave number and w is the angular frequency. (b) Frequency response of the peak-to-valley amplitudes, normalized to the maximum values of each cell. The curves are calculated by the active membrane wave model proposed by Nir S. Gov.
(a) Membrane topography of a cell (i) before and (ii) 23 min after the treatment of 75 mM BBI. (iii) Kymograph of the membrane topography along the white dashed line. We treated the cell at the 9th min, washed out the reagent at the 39th min, and re-started the measurement at the 41st min. A peak re-occurs after washing out BBI. (b) Membrane topography of a cell (i) before and (ii) 25 min after the treatment of 100 nM LA. (iii) Kymograph of the membrane topography along the white dashed line.
Nanoparticle internalization on cellular membranes
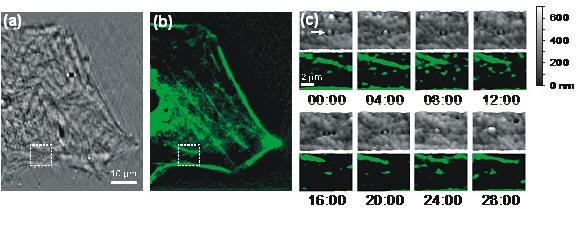
We use the NIWOP technique to trace the height of an 80 nm gold particle on the membrane by calibrating the change of light intensity scattered from the particle along the optical axis. On the membrane, the depth resolution based on the scattering signal is similar to that based on the reflection signal, nearly 20nm. Comparing the heights of the nanoparticle and the nearby cell membranes, we can identify the occurrence of particle internalization. Combining fluorescence microscopy with NIWOP, we also find actin aggregation around the site of the internalization process, which is an indication of endocytosis.
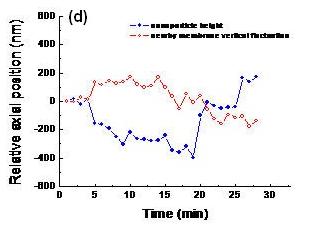
The above are bright field and NIWOP images of a gold nanoparticle on the cellular membrane. (a) Bright-field image of a fibroblast. (b) Membrane topography of the same cell in (a) obtained by NIWOP. (c) Time-lapse images of the region enclosed by the dashed squares in (a) and (b) captured during the internalization process. The timing format is in min:sec. In each panel, the upper part is the bright-field image and the lower part is the membrane topography. The viewing angle is slightly tilted for better visualization. A white arrow indicates the nanoparticle bound on the membrane. Some particles float around but do not stay on the membrane. (d) The change of membrane height (red) and the vertical position of the gold nanoparticle (blue) along with the observation time.
We also see the GFP-actin signal during the internalization process:
The aggregation of actin is a feature of endocytosis. In this figure, (a) Membrane topography of a fibroblast obtained by NIWOP. (b) GFP-actin distribution of the same cell in (a). (c) Time-lapse images of the region enclosed by the dashed squares in (a) and (b) captured during the internalization process. The timing format is in min:sec. In each panel the upper one is the membrane topography and the lower one is the fluorescence image of GFP-actin. The viewing angle is slightly tilted for better visualization. A white arrow indicates the nanoparticle bound on the membrane. (d) The change of membrane height (red) and the vertical position of the gold nanoparticle (blue) along with the observation time. We can see that the nanoparticle is finally expelled out by this cell.
Simultaneously tracking a nanoparticle and profiling cellular membranes
In this figure, we can see the positions of a 60-nm gold nanoparticle (red dots) relative to the cell membrane topography. After 10 min and 50 sec the particle stays under the membrane, which could be recognized as a complete internalization.
In this figure, however, we see that the internalized gold nanoparticle soon moves back onto the membrane surface. This activity can represent a cycling endocytosis.
Publications about Research on Cellular Membranes
- Chau-Hwang Lee, Chinlin Guo, and Jyhpyng Wang, "Optical measurement of the viscoelastic and biochemical responses of living cells to mechanical perturbation," Optics Letters 23, 307 (1998).
- Chun-Chieh Wang, Junn-Yuan Lin, and Chau-Hwang Lee, "Membrane ripples of a living cell measured by non-interferometric widefield optical profilometry," Optics Express 13, 10665 (2005).
- Chun-Chieh Wang, Junn-Yuan Lin, Hsiao-Chao Chen, and Chau-Hwang Lee, "Dynamics of cell membranes and the underlying cytoskeletons observed by non-interferometric widefield optical profilometry and fluorescence microscopy," Optics Letters 31, 2873 (2006).
- C.-C. Wang, C.-W. Lee, C.-Y. Huang, J.-Y. Lin, P.-K. Wei, and C.-H. Lee, "Internalization of nanoparticles on cell membranes observed by non-interferometric widefield optical profilometry," Applied Optics 47, 2458 (2008).
- Chun-Chieh Wang, Chia-Pin Liang, and Chau-Hwang Lee, "Three-dimensional nanoparticle tracking and simultaneously membrane profiling during endocytosis of living cells,” Applied Physics Letters 95, 203702 (2009).
- Chien-Hong Chen, Feng-Ching Tsai, Chun-Chieh Wang, and Chau-Hwang Lee, "Three-dimensional characterization of active membrane waves on living cells," Physical Review Letters 103, 238101 (2009).